

Rawgraphs App
RAWGraphs App provides a web interface for creating custom vector-based visualizations with the RAWGraphs core.
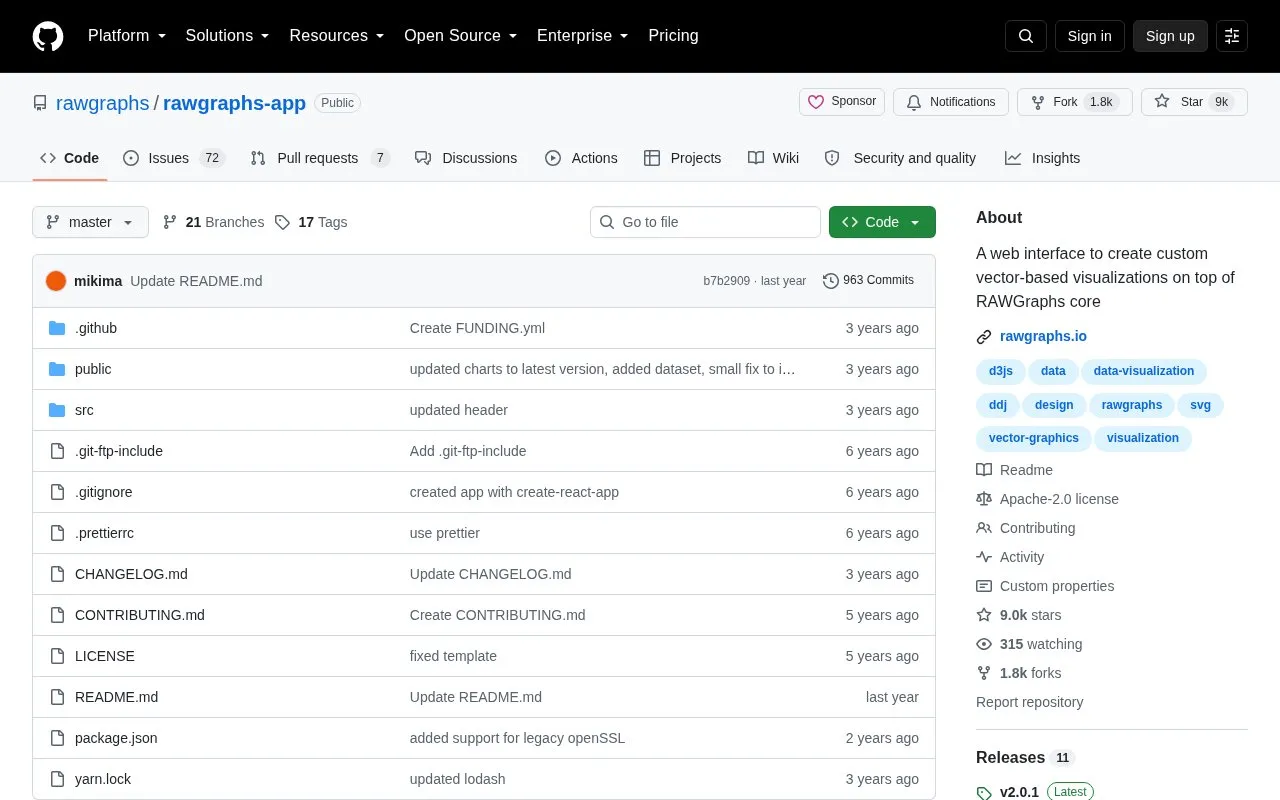
About Rawgraphs App
RAWGraphs App is a web interface for creating custom vector-based visualizations with the RAWGraphs core, which is built on d3.js. It works with tabular data such as spreadsheets and comma-separated values, as well as copied-and-pasted text, and produces SVG output that can be edited in vector graphics editors or embedded in web pages.
The project states that injected data is processed only by the web browser, with no server-side operations or storage. The code can also be run locally, which requires Git, Node.js, Yarn and use of console commands.
Key features
- Creates custom vector-based visualizations using RAWGraphs core
- Works with spreadsheets and comma-separated values data
- Accepts copied-and-pasted text from other applications
- Outputs SVG editable in vector graphics editors
- Allows embedding visualizations directly into web pages
- Accepts new custom layouts defined by users
Best for: Designers and visualization practitioners who turn spreadsheet data into editable vector graphics.
Good for
- Data is described as processed only in the web browser with no server-side storage
- Produces SVG output that can be edited or embedded in web pages
- Source code can be run locally and extended with custom layouts
Watch out for
- Local setup requires Git, Node.js, Yarn and console commands
- Contributors must sign a Contributor License Agreement before submitting
Rawgraphs App at a glance
- Category
- Design & Creative › Charts & Data Visualization
- Type
- Open-source project
- Pricing
- Not confirmed. Check the site
- Open source
- Yes · Source code
- Language
- English
- Good for
- Designers, Developers
- Last checked
- Oct 5, 2026 · Online when checked
- Listed
- Oct 5, 2026
Guides for Charts & Data Visualization
Rawgraphs App alternatives
Tools and sites you could use instead, ranked by how closely they match.

Svgbob converts text-based ASCII diagrams into SVG graphics, with both a library and command-line interface.
Open source
24 alternatives
torchvista visualizes a PyTorch model’s forward pass in notebooks and can export the visualization as an image, SVG, or HTML.
Open source
24 alternatives
Kroki CLI converts diagram files through the Kroki service, inferring diagram type from the file extension by default.
Open source
24 alternatives
UMLet provides free, open source UML drawing with a simple interface for making diagrams, including sequence and activity diagrams.

draw.io provides a free, open source application for creating diagrams, with storage options chosen by each team.

Gadfly provides statistical graphics and plotting tools for the Julia programming language.
Popular in Charts & Data Visualization
Well-known listings from the same topic.
Data GIF Makerdatagifmaker.withgoogle.comDatawrapperdatawrapper.deDataVizCataloguedatavizcatalogue.comLineGraphMakerlinegraphmaker.coaltairaltair-viz.github.ioCharts Buildercharts.hohli.com


Rawgraphs App FAQ
How do I use RAWGraphs without installing it?
Access the current version on the official app page at app.rawgraphs.io.
What types of input does it accept?
Tabular data such as spreadsheets and comma-separated values, plus copied-and-pasted text from other applications.
What is required to run it locally?
Git, Node.js and Yarn, plus cloning the repository and running install and start or build commands.
Is something wrong or out of date?
Tell us and an editor will check it.
Own this website?
Claim this listing
Claim the listing and suggest updates yourself. An editor checks every claim first.