

CLI
Kroki CLI converts diagram files through the Kroki service, inferring diagram type from the file extension by default.
About CLI
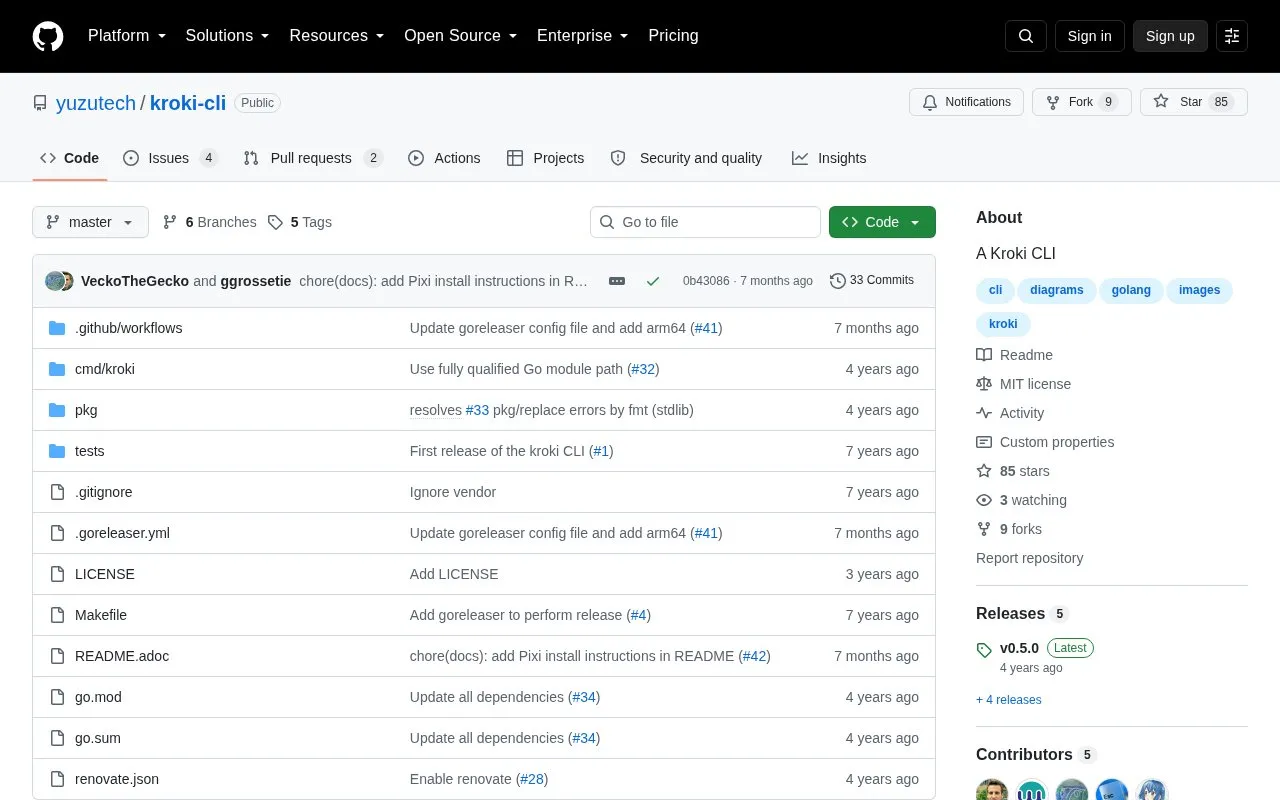
Kroki CLI is a command-line tool that converts diagram source files into image output through the Kroki service at kroki.io. By default, it infers the diagram type from the file extension and writes SVG output. The tool is distributed as an MIT-licensed open source repository on GitHub.
The default endpoint is the Kroki demonstration server, https://demo.kroki.io, which is restricted to reasonable, non-commercial use and carries no uptime or latency guarantee. The endpoint and HTTP timeout can be changed through a configuration file or environment variables. Because conversion runs through the Kroki service, diagram content is sent to that service, or to a server the user configures.
Key features
- Converts diagram files by inferring the diagram type from the file extension
- Sets the diagram type and output format explicitly with flags
- Infers the output format from the output file name
- Reads diagram input from stdin and writes output to stdout
- Configurable endpoint and HTTP timeout through a config file or environment variables
Best for: Developers and technical writers who want to convert diagram source files into images from a terminal or script.
Good for
- Open source under the MIT license
- Works with standard shell piping through stdin and stdout
- Endpoint can be pointed at a self-hosted Kroki server
Watch out for
- The demonstration server is limited to reasonable, non-commercial use
- No guarantee of uptime or latency is provided for the demonstration server
CLI at a glance
- Category
- Design & Creative › Charts & Data Visualization
- Type
- Open-source project
- Pricing
- Not confirmed. Check the site
- Open source
- Yes · Source code
- Language
- English
- Last checked
- Oct 6, 2026 · Online when checked
- Listed
- Oct 5, 2026
Guides for Charts & Data Visualization
CLI alternatives
Tools and sites you could use instead, ranked by how closely they match.

Kroki provides one API for generating diagrams from textual descriptions using libraries such as Mermaid, PlantUML, Graphviz, and D2.

UMLet provides free, open source UML drawing with a simple interface for making diagrams, including sequence and activity diagrams.
SankeyMATIC builds flow diagrams for comparing quantities across stages, with examples covering budgets, results, and processes.

text2diagram creates diagrams and charts from text descriptions, with real-time collaboration and document permissions listed on its page.
PlantText provides an online editor for PlantUML code and generates class, sequence, activity, and state diagrams.

Mermaid generates diagrams such as flowcharts and sequence diagrams from text using syntax similar to Markdown.
Open source
24 alternativesPopular in Charts & Data Visualization
Well-known listings from the same topic.
Data GIF Makerdatagifmaker.withgoogle.comDatawrapperdatawrapper.deDataVizCataloguedatavizcatalogue.comLineGraphMakerlinegraphmaker.coaltairaltair-viz.github.ioCharts Buildercharts.hohli.com


CLI FAQ
How does the tool determine the diagram type?
By default, the diagram type is inferred from the diagram file extension. The --type flag can be used to set it explicitly.
Can the tool use a Kroki server other than the demonstration server?
Yes. The endpoint can be set in a kroki.yml file in /etc, $HOME, or the current directory, with the --config flag, or with the KROKI_ENDPOINT environment variable.
Is something wrong or out of date?
Tell us and an editor will check it.
Own this website?
Claim this listing
Claim the listing and suggest updates yourself. An editor checks every claim first.