

text2diagram
text2diagram creates diagrams and charts from text descriptions, with real-time collaboration and document permissions listed on its page.
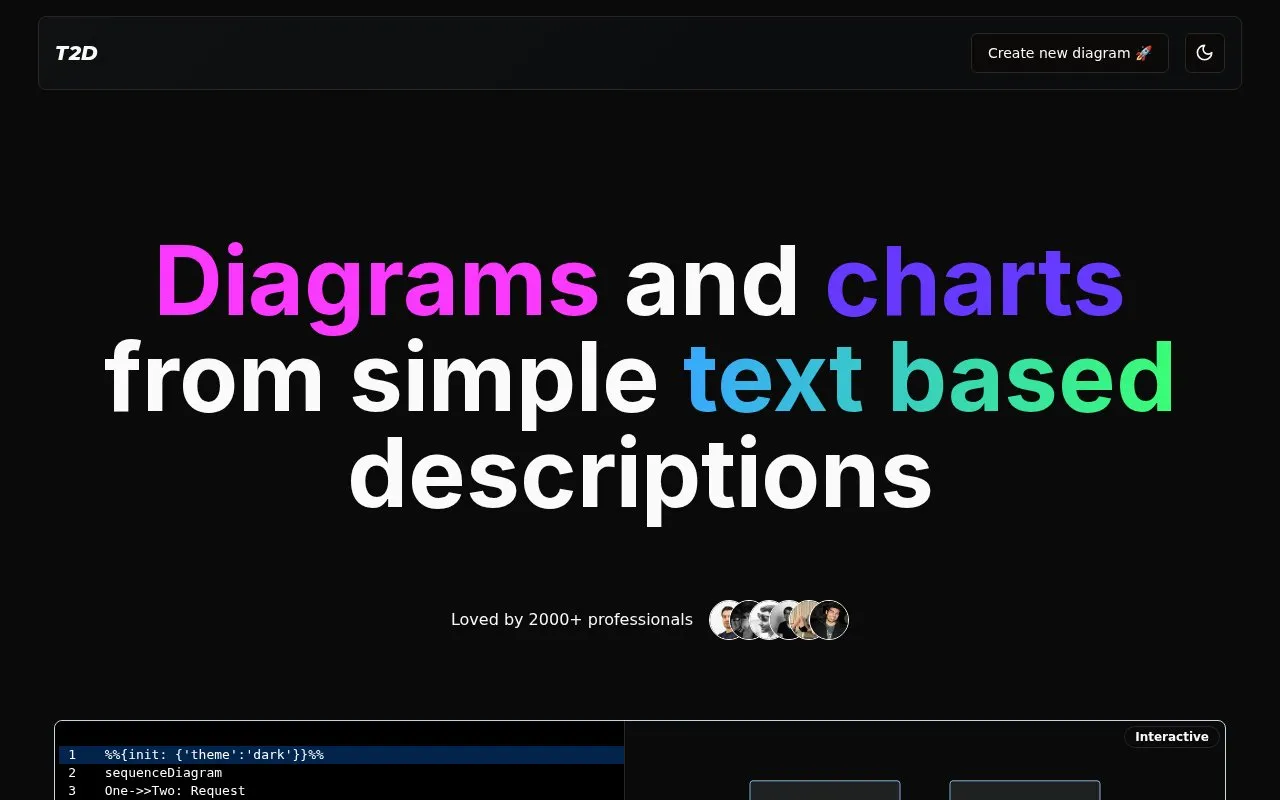
About text2diagram
text2diagram is a web tool for creating diagrams and charts from simple text descriptions. Diagrams are defined using Mermaid syntax, which the homepage describes as an open source language that supports several diagram types and customization options. Multiple people can edit a diagram together in real time, and the owner can set document permissions to allow others to view or edit, to make a diagram publicly accessible to anyone, or to keep it private.
Diagrams can be shared by link or embedded on other websites, and embedded images update when the diagram definition changes. Snapshots can be downloaded as PNG, JPEG, SVG, or WEBP. The homepage does not state pricing, and it does not answer its own question about whether diagrams are secure. Public diagrams are accessible to anyone, so users should consider the permission setting before sharing sensitive content.
Key features
- Creates diagrams and charts from text descriptions using Mermaid syntax
- Real-time collaboration on the same diagram with other users
- Document permissions for view or edit access by others
- Public or private visibility settings for each diagram
- Embedded diagrams that update when the diagram definition changes
- Snapshot export as PNG, JPEG, SVG, or WEBP files
Best for: Engineers and other professionals who want to create and share technical diagrams from text descriptions.
Good for
- Uses Mermaid syntax, which the homepage describes as open source and quick to learn
- Shared and embedded images update automatically when the diagram changes
- Diagram snapshots can be exported in several common image formats
text2diagram at a glance
- Website
- text2diagram.com
- Category
- Design & Creative › Charts & Data Visualization
- Type
- Website
- Pricing
- Not confirmed. Check the site
- Platforms
- Web
- Open source
- Not stated
- Language
- English
- Last checked
- Oct 6, 2026 · Online when checked
- Listed
- Oct 5, 2026
Guides for Charts & Data Visualization
text2diagram alternatives
Tools and sites you could use instead, ranked by how closely they match.
SankeyMATIC builds flow diagrams for comparing quantities across stages, with examples covering budgets, results, and processes.

Kroki provides one API for generating diagrams from textual descriptions using libraries such as Mermaid, PlantUML, Graphviz, and D2.

UMLet provides free, open source UML drawing with a simple interface for making diagrams, including sequence and activity diagrams.
PlantText provides an online editor for PlantUML code and generates class, sequence, activity, and state diagrams.

Kroki CLI converts diagram files through the Kroki service, inferring diagram type from the file extension by default.
Open source
24 alternatives
Tree generates ASCII diagrams of folder structures as a browser utility written in TypeScript and React.
Popular in Charts & Data Visualization
Well-known listings from the same topic.
Data GIF Makerdatagifmaker.withgoogle.comDatawrapperdatawrapper.deDataVizCataloguedatavizcatalogue.comLineGraphMakerlinegraphmaker.coaltairaltair-viz.github.ioCharts Buildercharts.hohli.com


text2diagram FAQ
What syntax is used to create diagrams?
Diagrams are defined using Mermaid syntax, which the homepage describes as an open source language that is quick to learn.
How can diagrams be shared or embedded?
Diagrams can be shared by sending a link or embedded anywhere on the web. Shared and embedded images are updated automatically when the diagram definition is changed.
What file formats can diagrams be exported in?
Snapshots of diagrams can be downloaded as PNG, JPEG, SVG, or WEBP files.
Is something wrong or out of date?
Tell us and an editor will check it.
Own this website?
Claim this listing
Claim the listing and suggest updates yourself. An editor checks every claim first.