

ParaView
ParaView analyzes and visualizes data across settings ranging from laptops to supercomputers, according to its project site.
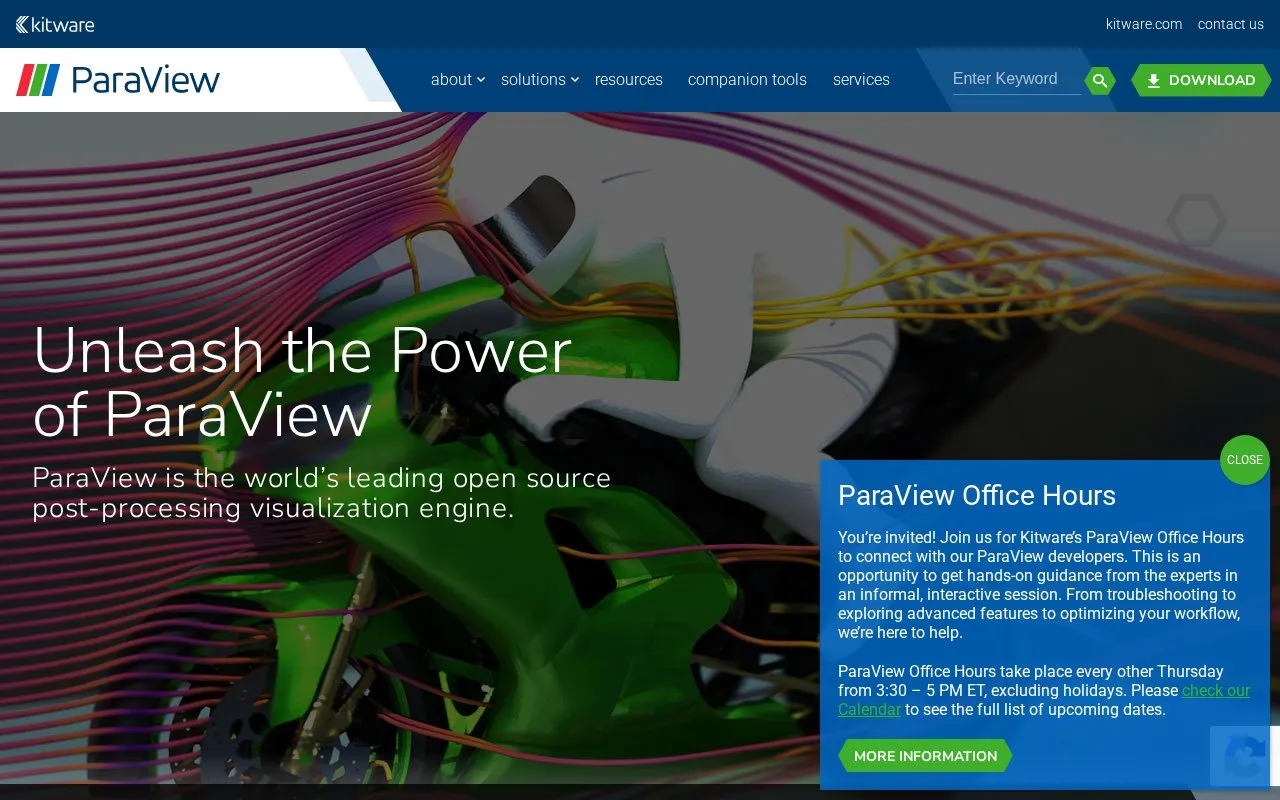
About ParaView
ParaView is a multi-platform data analysis and visualization application developed by Kitware, described on its project site as open source. It was built to analyze extremely large datasets using distributed memory computing resources, and can run on supercomputers for petascale-size data as well as on laptops for smaller datasets. It can also run in situ through ParaView Catalyst and in a web browser using trame.
Key features
- Analyzes extremely large datasets using distributed memory computing resources
- Runs on supercomputers for petascale data and on laptops for smaller data
- In situ visualization and analysis through ParaView Catalyst
- Runs in a web browser using trame
- Illustrated uses include material science, engineering, medical science, CFD and sensor data
Best for: Researchers and engineers who need to analyze and visualize large scientific, simulation or sensor datasets on hardware ranging from laptops to supercomputers.
Good for
- Project site describes it as open source and free to download
- Stated to scale from laptops to supercomputers
- Developers offer training, customization services and recurring office hours
Watch out for
- Homepage does not list supported file formats, system requirements or plan pricing
- Office hours are held every other Thursday, 3:30-5 PM ET, excluding holidays
ParaView at a glance
- Website
- paraview.org
- Category
- Design & Creative › Charts & Data Visualization
- Type
- Online tool
- Pricing
- Not confirmed. Check the site
- Platforms
- Web
- Open source
- Not stated
- Language
- English
- Last checked
- Oct 5, 2026 · Online when checked
- Listed
- Oct 5, 2026
Guides for Charts & Data Visualization
ParaView alternatives
Tools and sites you could use instead, ranked by how closely they match.

Lux automatically visualizes Pandas DataFrames to support data exploration.
Open source
24 alternatives
For custom data visualizations in JavaScript, D3.js provides tools for scales, axes, transitions, and DOM updates.

Histogram Maker creates customizable histograms from entered values or imported CSV and Excel data, with image download options.

Plotly provides an open-source Python library for creating interactive charts and data visualizations.

Apache Superset is an open-source platform for data visualization and exploration.
Open source
24 alternatives
ipychart brings Chart.js plotting capabilities to Python and notebook workflows.
Open source
24 alternativesPopular in Charts & Data Visualization
Well-known listings from the same topic.
Data GIF Makerdatagifmaker.withgoogle.comDatawrapperdatawrapper.deDataVizCataloguedatavizcatalogue.comLineGraphMakerlinegraphmaker.coaltairaltair-viz.github.ioCharts Buildercharts.hohli.com


ParaView FAQ
Is ParaView free to use?
The project site says users can download ParaView and start exploring their data for free. No pricing is published for Kitware's customization or training services.
How large a dataset can ParaView handle?
The site states it can be run on supercomputers to analyze datasets of petascale size, and on laptops for smaller data, using distributed memory computing resources.
Can ParaView run in a browser or during a simulation?
According to the project site, it can be run in situ using ParaView Catalyst and in a web browser using trame.
Is something wrong or out of date?
Tell us and an editor will check it.
Own this website?
Claim this listing
Claim the listing and suggest updates yourself. An editor checks every claim first.