

Lux
Lux automatically visualizes Pandas DataFrames to support data exploration.
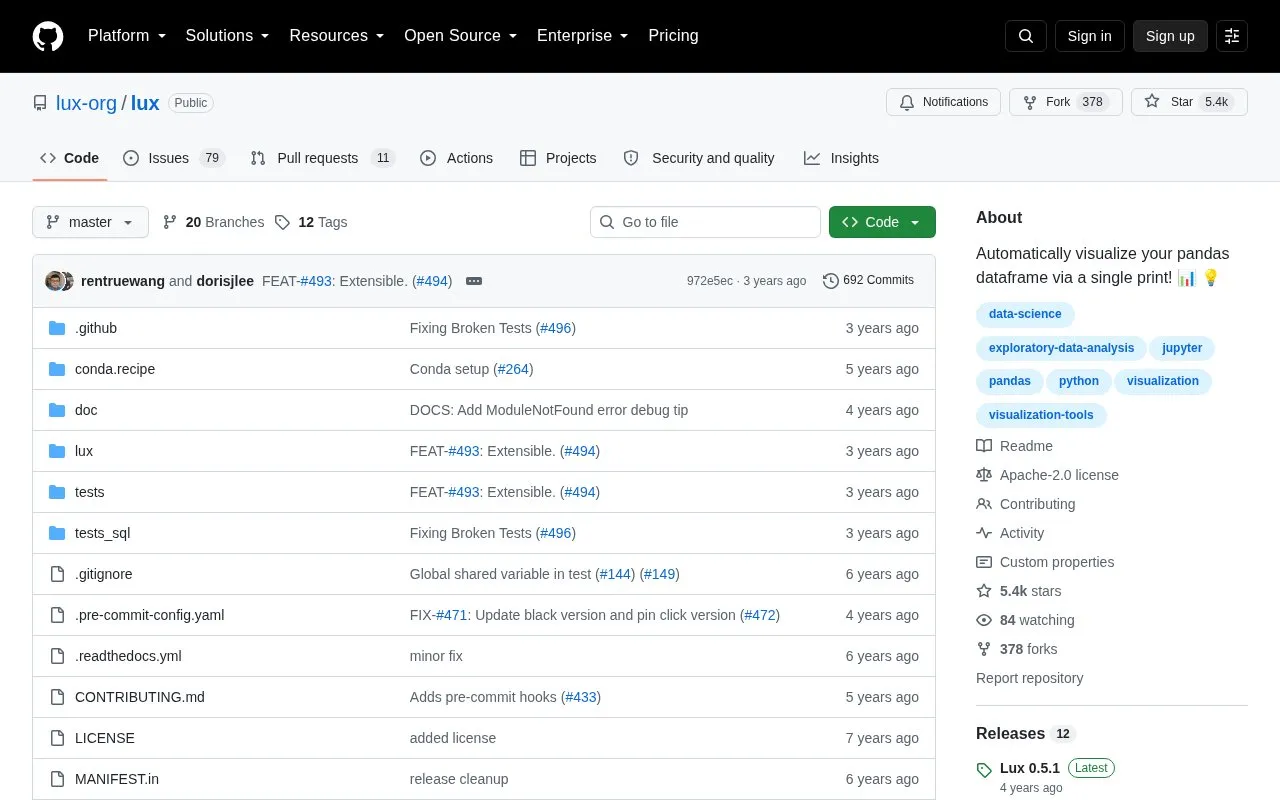
About Lux
Lux is an open-source Python library that automates visualization of Pandas DataFrames to support exploratory data analysis. It operates within Jupyter notebooks, generating a set of recommended visualizations highlighting trends and patterns in a dataset as soon as the DataFrame is printed, presented via an interactive widget for easy browsing.
Users can specify attributes of interest via the df.intent property to receive tailored next-step visualization recommendations organized into Enhance, Filter, and Generalize tabs. Generated visualizations can be exported as static HTML, or translated to Altair, Matplotlib, or Vega-Lite code for further customization, and the library works with existing Pandas code without requiring modifications.
Key features
- Auto-generates visualizations for Pandas DataFrames on print
- Interactive widget to browse recommended visualizations
- Intent-based next-step visualization recommendations
- Export visualizations as static shareable HTML
- Translate visualizations to Altair, Matplotlib, or Vega-Lite
- Works with existing Pandas code without modifications
Best for: Data analysts and data scientists using Pandas in Jupyter notebooks for exploratory data analysis.
Good for
- Requires only an extra import, no changes to existing Pandas workflows
- Provides interactive, intent-driven recommendations to speed up data exploration
- Supports export to HTML and translation to common plotting libraries for customization
Watch out for
- Only compatible with Pandas DataFrames, no support for other data structures noted
- Interactive visualization features are limited to Jupyter notebook environments
- No documented support for non-Jupyter Python environments
Lux at a glance
- Website
- github.com/lux-org/lux
- Category
- Design & Creative › Charts & Data Visualization
- Type
- Open-source project
- Pricing
- Not confirmed. Check the site
- Open source
- Yes · Source code
- Language
- English
- Last checked
- Oct 6, 2026 · Online when checked
- Listed
- Oct 5, 2026
Guides for Charts & Data Visualization
Lux alternatives
Tools and sites you could use instead, ranked by how closely they match.

Apache Superset is an open-source platform for data visualization and exploration.
Open source
24 alternatives
ipychart brings Chart.js plotting capabilities to Python and notebook workflows.
Open source
24 alternatives
teeplot organizes visualization output and names files based on semantic plotting variables.
Open source
24 alternatives
ParaView analyzes and visualizes data across settings ranging from laptops to supercomputers, according to its project site.

Plotly provides an open-source Python library for creating interactive charts and data visualizations.

For custom data visualizations in JavaScript, D3.js provides tools for scales, axes, transitions, and DOM updates.
Popular in Charts & Data Visualization
Well-known listings from the same topic.
Data GIF Makerdatagifmaker.withgoogle.comDatawrapperdatawrapper.deDataVizCataloguedatavizcatalogue.comLineGraphMakerlinegraphmaker.coaltairaltair-viz.github.ioCharts Buildercharts.hohli.com


Lux FAQ
How do I enable Lux for my Pandas DataFrames?
Add an import lux statement alongside your Pandas import; no existing code modifications are required.
How can I specify which data attributes I want to explore?
Set the df.intent property to a list of your desired attributes to receive tailored visualization recommendations.
Can I edit or share Lux's generated visualizations?
Yes, visualizations can be saved as static HTML, or translated to Altair, Matplotlib, or Vega-Lite code for further editing.
Is something wrong or out of date?
Tell us and an editor will check it.
Own this website?
Claim this listing
Claim the listing and suggest updates yourself. An editor checks every claim first.