

Family Chart
family-chart is a D3-based library for visualizing interactive family trees, with examples and additional features documented in its repository.
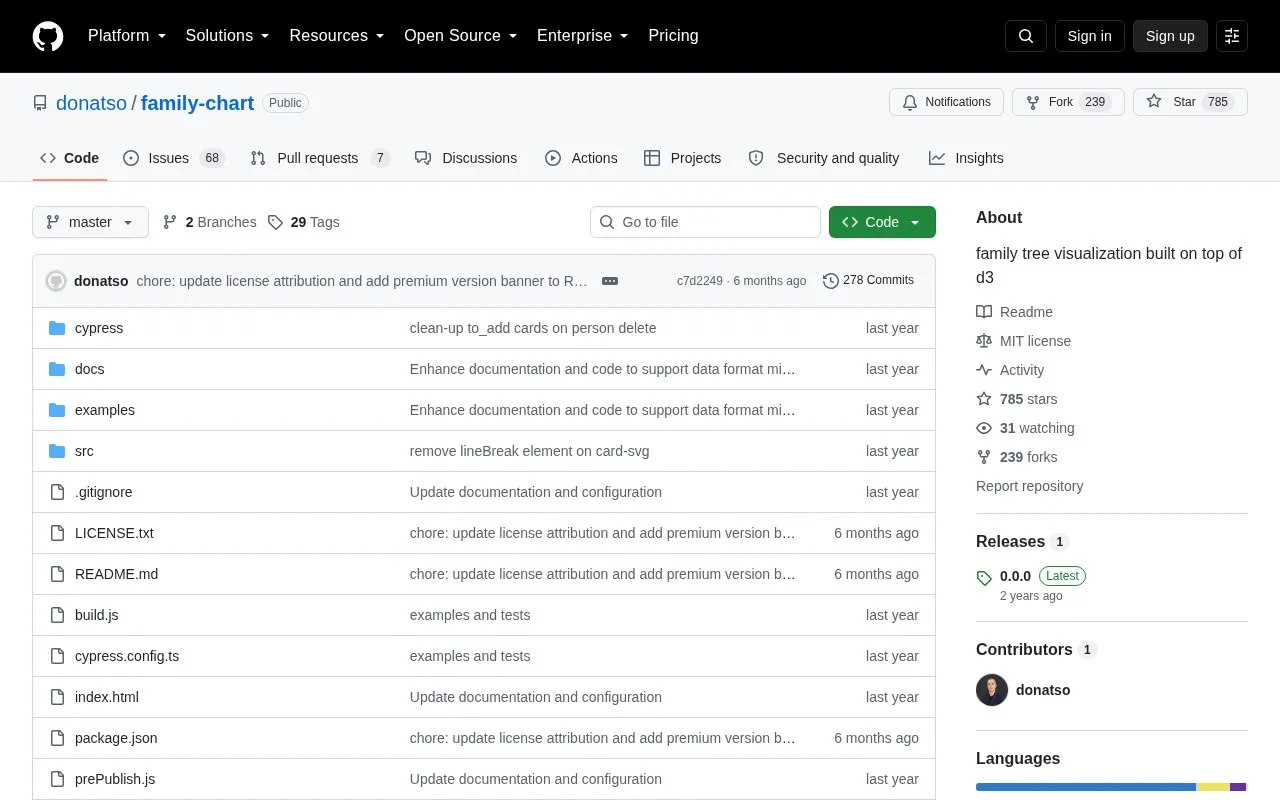
About Family Chart
Family Chart is an open-source, MIT-licensed JavaScript library built on D3.js for creating interactive family tree visualizations. It includes pre-built examples, a visual builder for configuration and code generation, and supports major JavaScript frameworks as well as vanilla JavaScript and TypeScript.
A separate premium version offers additional features including advanced card variants, performance optimizations, and tree filtering.
Key features
- Interactive family trees with zoom and pan navigation
- Customizable styling for colors, fonts, and layout
- Supports React, Vue, Angular, Svelte, and vanilla JavaScript
- Full TypeScript type definitions included
- Real-time dynamic tree updates and modifications
- Visual builder for configuration and code generation
Best for: Web developers building interactive family tree visualizations for web applications are the primary users of this library.
Good for
- Open-source under MIT license, allowing free use and modification
- Includes a visual builder and pre-built examples to simplify implementation
- Supports all major JavaScript frameworks and TypeScript natively
Watch out for
- Advanced features like kinship engine and tree filtering require the separate premium version
Family Chart at a glance
- Category
- Design & Creative › Charts & Data Visualization
- Type
- Open-source project
- Pricing
- Not confirmed. Check the site
- Open source
- Yes · Source code
- Language
- English
- Last checked
- Oct 5, 2026 · Online when checked
- Listed
- Oct 5, 2026
Guides for Charts & Data Visualization
Family Chart alternatives
Tools and sites you could use instead, ranked by how closely they match.

SolidUI generates graphs from a sentence, according to its repository description.
Open source
24 alternatives
The draw.io repository contains the JavaScript client-side editor for general diagramming and whiteboarding.
Open source
24 alternatives
Hanami provides interactive plotting and charting with ClojureScript and Vega.
Open source
24 alternatives
torchvista visualizes a PyTorch model’s forward pass in notebooks and can export the visualization as an image, SVG, or HTML.
Open source
24 alternatives
Lux automatically visualizes Pandas DataFrames to support data exploration.
Open source
24 alternatives
JSON Crack is an open source visualization application that turns JSON, YAML, XML, and CSV data into interactive graphs.
Open source
24 alternativesPopular in Charts & Data Visualization
Well-known listings from the same topic.
Data GIF Makerdatagifmaker.withgoogle.comDatawrapperdatawrapper.deDataVizCataloguedatavizcatalogue.comLineGraphMakerlinegraphmaker.coaltairaltair-viz.github.ioCharts Buildercharts.hohli.com


Family Chart FAQ
Is the core Family Chart library free to use?
The core library is open-source under the MIT license and free to use; a separate premium version with advanced features is available.
Which JavaScript frameworks does Family Chart support?
It supports React, Vue, Angular, Svelte, and vanilla JavaScript.
How can I report bugs or request features for Family Chart?
Bugs can be reported via the GitHub issue tracker, and feature requests can be sent to [email protected].
Is something wrong or out of date?
Tell us and an editor will check it.
Own this website?
Claim this listing
Claim the listing and suggest updates yourself. An editor checks every claim first.