

Octopus
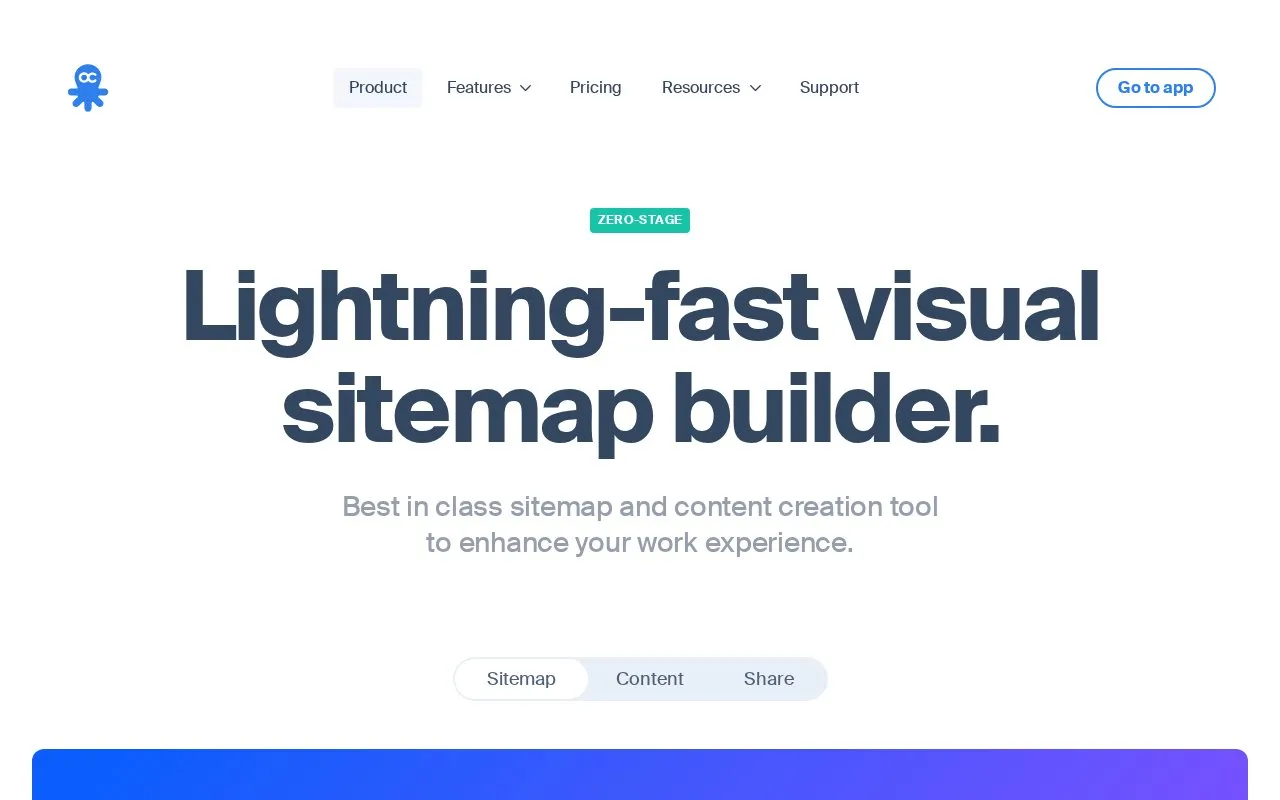
Plan website architecture with Octopus.do, a visual sitemap builder that includes low-fidelity wireframes.
About Octopus
Octopus is a web-based visual sitemap builder for planning website architecture and structure. Users can view a site's page structure visually, add new pages or blocks, and make changes before building. According to the directory description, it includes low-fidelity wireframes for prototyping.
Projects can begin by crawling an existing website, choosing a template, or generating a project from a written prompt with AI. Content can be organized individually or with a team, and written manually or with AI help. The homepage does not give details on AI or crawling limits, or on how content is handled when those features are used. Pricing is not confirmed in the source.
Key features
- Visual sitemap builder for viewing website page structure
- Add new pages or blocks to an existing site structure
- Crawl an existing website to create a project with metadata
- Browse a template collection to start a project
- Generate a project from a written prompt using AI
- Share sitemaps with others without requiring sign-up
Best for: Web designers, UX professionals, SEO consultants, and project managers who plan website structure with clients or teams before building.
Good for
- The homepage states that sharing does not require sign-up.
- Projects can start from a crawled website, a template, or an AI prompt.
- The directory description says the tool includes low-fidelity wireframes.
Octopus at a glance
- Website
- octopus.do/sitemap
- Category
- Design & Creative › Charts & Data Visualization
- Type
- Online tool
- Pricing
- Not confirmed. Check the site
- Platforms
- Web
- Open source
- Not stated
- Language
- English
- Good for
- Designers
- Last checked
- Oct 6, 2026 · Online when checked
- Listed
- Oct 5, 2026
Guides for Charts & Data Visualization
Octopus alternatives
Tools and sites you could use instead, ranked by how closely they match.

Create wireframes and user flow prototypes with Wireflow, a free online design tool.
Free
24 alternatives
Chart Builder creates charts from CSV or TSV data, including pie, bar, line, area, scatter, and donut charts.

Charts Builder creates and customizes charts through the Google Charts API, with output code available to copy.

CASCII provides an open-source ASCII diagram builder written in JavaScript, according to its page description.

Datawrapper creates interactive charts, maps, and tables in a web app without requiring code, according to its site.
Pick
24 alternativesSIMILE Exhibit helps publish data-rich web pages through a framework for presenting information.
Popular in Charts & Data Visualization
Well-known listings from the same topic.
Data GIF Makerdatagifmaker.withgoogle.comDataVizCataloguedatavizcatalogue.comLineGraphMakerlinegraphmaker.coaltairaltair-viz.github.ioPie Chart Makerpiechartmaker.coPlantUMLplantuml.com


Octopus FAQ
Do people need an account to view a shared sitemap?
The homepage says sitemaps can be shared with anyone, and no sign-up is required.
Can a project start from an existing website?
Yes. The homepage says a user can crawl an existing website to build a project with metadata.
Can website content be generated with AI?
The homepage says content can be generated manually or with the help of AI, and it includes a text editor for formatting.
Is something wrong or out of date?
Tell us and an editor will check it.
Own this website?
Claim this listing
Claim the listing and suggest updates yourself. An editor checks every claim first.