

EuraAtlas presents a historical atlas of Europe with maps of mountains, rivers, and regions.
World Population Density
World Population Density maps population patterns and urban regions using Global Human Settlement Layer data.
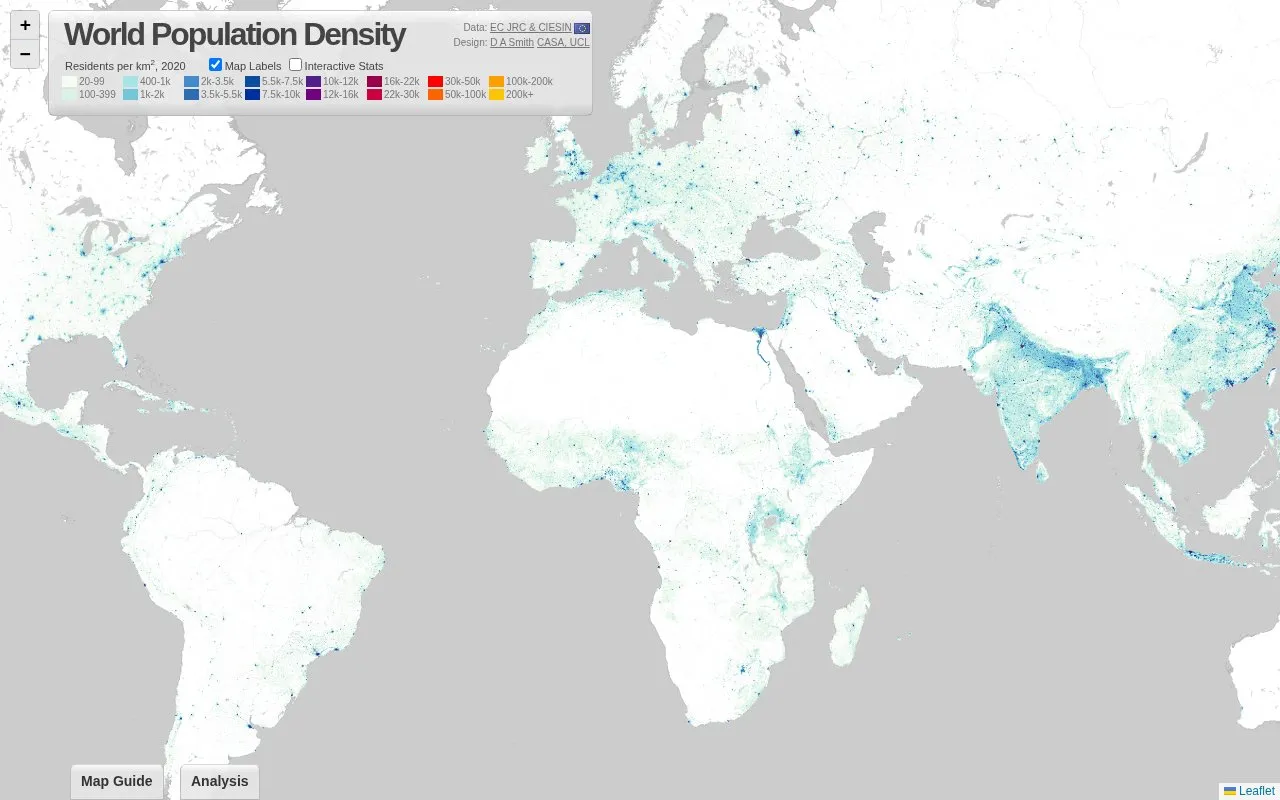
About World Population Density
World Population Density is an interactive web map that shows population density across the globe for 2020, measured in residents per square kilometre. The map uses data from the Global Human Settlement Layer (GHSL) 2023, produced by the European Commission Joint Research Centre and the Center for International Earth Science Information Network at Columbia University. The GHSL combines satellite data with national census data to describe settlement patterns beyond simple rural and urban divisions. The site includes written discussion of topics such as India's rural and urban landscapes, megacity regions in the United States and China, and the relationship between density and development.
The site has a Map Guide and an Analysis page. The source states that the ranking of the highest-density cities depends on how density is measured, and it directs readers to the Analysis page for that explanation. The map is designed by D A Smith of CASA, UCL.
Key features
- Interactive global map of population density for 2020 in residents per square kilometre
- Colour legend with density bands from 20 to over 200,000 residents per km²
- Links that zoom the map to specific regions, such as India
- Written discussion of megacity regions, including the Pearl River Delta and Yangtze River Delta
- Map Guide and Analysis pages explaining the data and how density is measured
- Based on Global Human Settlement Layer 2023 data from the European Commission JRC and CIESIN
Best for: Students, researchers, and general readers interested in where people live across the globe and how urban settlement patterns differ between regions.
Good for
- Combines satellite data with national census data to describe settlement geography
- Records settlement patterns beyond simple rural-urban divisions
- Pairs the map with written explanations and region-specific examples
Watch out for
- The map shows density for 2020 only, according to its stated scope
- Rankings of the highest-density cities depend on how density is measured
- Introductory highlights are brief and link out for further information
World Population Density at a glance
- Website
- luminocity3d.org/WorldPopDen
- Category
- Travel & Maps › Maps, Navigation & Weather
- Type
- Website
- Pricing
- Not confirmed. Check the site
- Platforms
- Web
- Open source
- Not stated
- Last checked
- Oct 6, 2026 · Online when checked
- Listed
- Oct 5, 2026
World Population Density alternatives
Tools and sites you could use instead, ranked by how closely they match.

WorldAtlas publishes geography articles and maps alongside science and current events content.

GeoShare is an Android app for opening map links in other map apps and copying coordinates.
Open source
16 alternatives
Light Pollution Map uses NASA data to display global light pollution and sky brightness layers.

Global Fishing Watch provides an open-access map for visualizing and analyzing marine traffic and vessel-based human activity.

MapChart lets users color custom maps of the world, regions, and states, add a legend, and download the result.
Popular in Maps, Navigation & Weather
Well-known listings from the same topic.
OpenWeatherMapopenweathermap.org511on.ca511on.caFIRMSfirms.modaps.eosdis.nasa.gov/mapWeather History & Data Archivewunderground.com/historyORBISorbis.stanford.eduEarth Engine Datasetdevelopers.google.com/earth-engine/datasets


World Population Density FAQ
What data does the map use?
The map uses the Global Human Settlement Layer (GHSL) 2023, produced by the European Commission JRC and the Center for International Earth Science Information Network at Columbia University. The GHSL integrates satellite data with national census data.
What year does the map show?
The map shows population density in 2020, measured in residents per square kilometre.
Does the choice of density measure affect the results?
Yes. The site notes that the list of the world's highest-density cities depends on how density is measured, and it refers readers to the Analysis page for details.
Is something wrong or out of date?
Tell us and an editor will check it.
Own this website?
Claim this listing
Claim the listing and suggest updates yourself. An editor checks every claim first.